DevTools Feature Request - console.scope()
September 2012Sometimes I just want to see all (or many) of the variables inside of the function, and it can be a bit of work to copy all of the variables into the console.log() call when you know that you are just going to delete the line afterwards anyway.
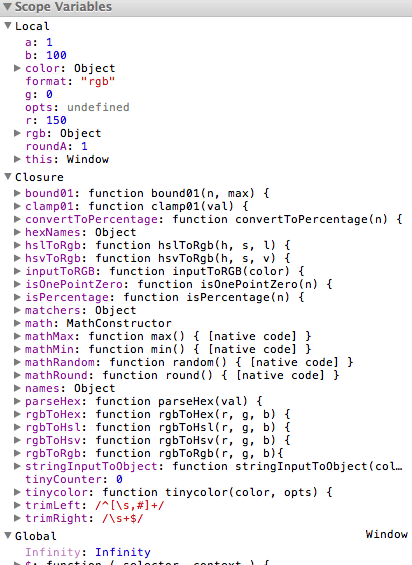
It would be great to have a console function that handles this. It would be called console.scope. When you call console.scope() it would act similarly to console.trace(), except instead of seeing the call stack in the console, you would see the same thing that you see in the 'Scope Variables' panel when inside a breakpoint in the Sources Panel (see images).
I have also opened a thread about this on the devtools mailing list.


September 13th, 2012 at 7:53 am
Great idea!
September 20th, 2012 at 9:03 am
How about using the statement “debugger;” ? in chrome this forces a breakpoint if the console is open; you can freely browse the scope variables then, and when you are done you let it continue.
September 20th, 2012 at 11:53 am
Mahn,
The debugger statement is a nice feature that I sometimes use, but can be disruptive, especially when it depends on some user interaction. For instance, imagine if you want to print out x/y coordinates of the mouse on a drag event or something – debugger would not work very well, as it would end the drag event. But you are right – this is pretty much the functionality I want.